Help / Dashboard and groups
Reading the dashboard
What each number, colour and chart means.
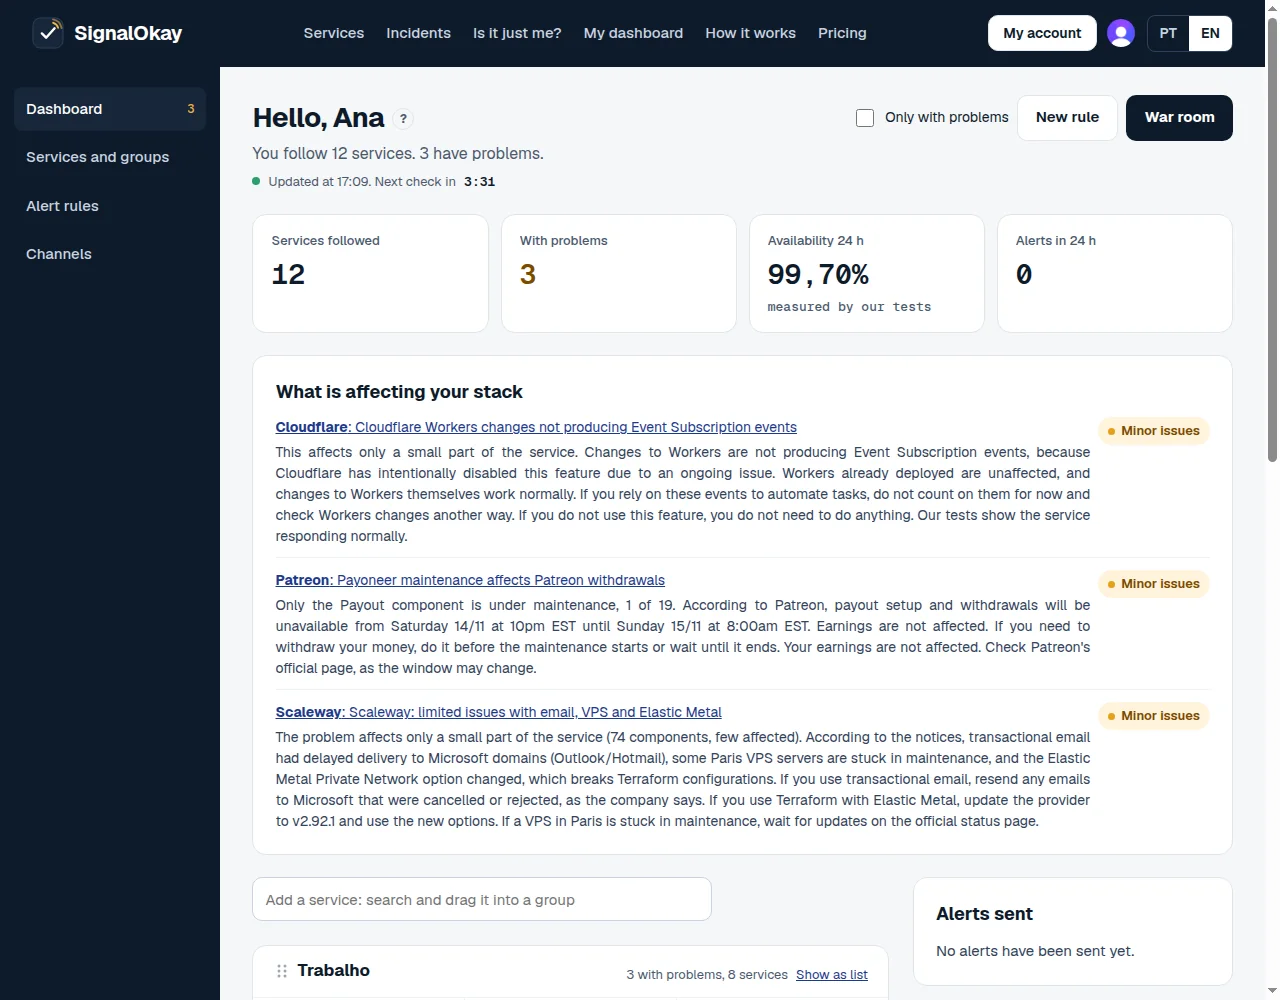
- Account menu: dashboard, services and groups, rules and channels.
- Time of the last update and countdown to the next check.
- Key numbers: services followed, with problems, availability and alerts in the last 24 hours.
- What is affecting your services, explained.
- War room: the screen for the wall, on the Premium plan.
Status colours
- Green, working: all normal.
- Amber, minor issues: works, but a secondary part has errors or slowness.
- Amber, partial outage: an important part does not work.
- Red, down: the service is unavailable.
- Blue, notice or maintenance: the company posted a note, but the service works.
Response time and availability
Each service shows the last response time, a chart of recent hours and the share of successful tests. Tests run every 5 minutes from Ireland (EU).
Still stuck?